Predicting Winning Play Styles in Texas Hold'em
Raymond Wang
Background
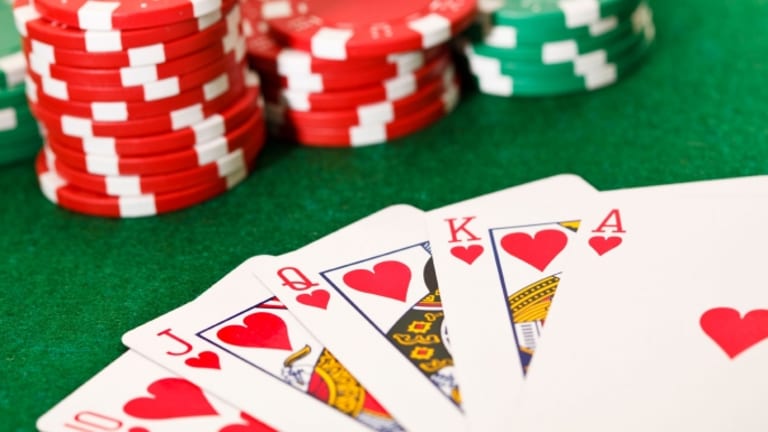
Poker is a very common family of card games where players wager money based on the strength of their hand. Texas Hold'em is the most popular variant of poker and is played among friends and in casinos, in person and online, throughout the world. The rules of Texas Hold'em are simple. Players are each dealt 2 cards and are competing to make the best hand possible using their own cards and the five cards displayed on the table. The different poker hands and ranks can be found here.
In Texas Hold'em, there are multiple rounds where players can either:
- check (no bet)
- call (match a bet)
- raise (increase the bet)
- fold (forfeit hand)
- Preflop - prior to the flop, no additional cards are shown on the table
- Flop - after the first three cards are exposed
- Turn - after the fourth card is exposed
- River - after the final fifth card is exposed. This is the last round before showdown
Poker, by nature, is a game of probability and psychology. By hedging your bets and bluffing you could either win or lose a lot of money. Understanding your own play style and your opponents' play styles are key to winning. There are certain metrics of measuring poker success. One of the most common metrics is Big Blinds Won per 100 Hands. If you win a large number of Big Blinds, that means you are making money at the poker table, which is the ultimate goal in Texas Hold'em. There also exists metrics that can determine a player's play style. The three metrics that are most common are:
- Voluntarily Put $ in pot (VPIP). This statistic measures how often a player puts money into the pot before the flop. The big blind and small blind fees are not included in this fee. A lower VPIP corresponds to a tigher player, meaning a player that only plays great starting hands. A higher VPIP typically indicates that a player is looser, or is willing to play more combinations of starting hands.
- Preflop Raise (PFR). This statistic measures how often a player raises before the flop. This statistic usually measures how aggressive a player is. A higher PFR indicates that a player is more aggressive. Meanwhile, a low PFR indicates that a player is timid.
- Postflop Aggression Frequency (Agg). This statistic is very similar to PFR but also offers insight to a players pyschological profile. Agg is measured on how often a player raises after the flop.
In order to analyze how these metrics correspond with winning, I will be using the online casino client logs found here. Though these logs were gathered by a single player, it shows outcomes from all players at the table. With this in mind, there should be sufficient data to uncover trends. Since the data appears as logs, a large amount of tidying will have to occur. After tidying the data, I will perform some exploratory data analysis on the players in this dataset. Finally, I will use regression to determine how players' VPIP, PFR, and Agg correspond with winning in poker. Hopefully, I will be able to uncover trends that can guide beginner players in the game of Texas Hold'em. For more professional poker players, I hope that my findings can help them reevaluate their play strategy.
Getting Started
I will be using Python 3 and a few imported libraries in this project. The libraries can be seen below.
import pandas as pd
import numpy as np
import matplotlib.pyplot as plt
import re
from sklearn.linear_model import LinearRegression
import statsmodels.api as sm
Tidying the Data
Step 1: Download, Import, and Gather Data
The dataset used in this project was downloaded from Kaggle at this link. This .txt file contains log data from 2468 poker hands. The data was downloaded locally and renamed to "hand_data.txt". Each line was read into a list in order to faciliate parsing. An example of how the file appears can be seen below.
# Open file and split each line into a list
with open("hand_data.txt") as f:
    lines = f.read().splitlines()
Step 2: Parse for Meaningful Data
Now that the logs are imported, the next step is parse the data for meaningful data. Meaningful data includes the Game ID, player IDs, blind information, starting stacks, actions, and winnings. A pandas dataframe will be used to collect this data. The Dataframe will follow the following columns:
(gameID, playerID, smallBlindAmount, bigBlindAmount, startingStack, smallBlind?, bigBlind?, preflopAction, preflopAmount, flopAction, flopAmount, turnAction, turnAmount, riverAction, riverAmount, finalWinnings)
Parsing through the data allows us to extract only the information that is necessary in our analysis. Other fields can be conveniently ignored. The fields that are extracted will help up in analyzing VPIP, PFR, and Agg. In order to succesfully parse this data, regular expressions must be used to extract only the information we need. The Regular Expression library will prove to be instrumental.
# define a list to store all data
data_list = []
# define a tuple to hold temporary data points
data_point = ()
# iterate through the lines of data
gameID = 0
smallBlind = 0.0
bigBlind = 0.0
for line in lines:
    # Game ID and blind information
    pattern = '^Game ID: (\d+) (\d*\.?\d+)/(\d*\.?\d+)'
    match = re.search(pattern, line)
    if match:
        gameID = int(match.group(1))
        smallBlind = float(match.group(2))
        bigBlind = float(match.group(3))
    # Player Information
    pattern = '^Seat \d+: (\S+) \((\d*\.?\d+)\)'
    match = re.search(pattern, line)
    if match:
        data_point = (gameID, smallBlind, bigBlind, match.group(1), float(match.group(2)))
        data_list.append(data_point)
# Add this data to a DataFrame
data = pd.DataFrame(data_list)
# Create additional columns and rename
data["smallBlind?"] = False
data["bigBlind?"] = False
data["preflopAction"] = "None"
data["preflopAmount"] = 0.0
data["flopAction"] = "None"
data["flopAmount"] = 0.0
data["turnAction"] = "None"
data["turnAmount"] = 0.0
data["riverAction"] = "None"
data["riverAmount"] = 0.0
data["finalWinnings"] = 0.0
data = data.rename(columns={0: "gameID", 1: "smallBlindAmount", 2: "bigBlindAmount", 3: "playerID", 4: "startingStack"})

# Parse the remaining data
gameID = 0
state = 0
"""
Need to use states in order to determine what round action is occurring on.
States:
0 : preflop
1 : flop
2 : turn
3 : river
"""
for line in lines:
    # State Determination
    preflop_pattern = 'Game started at:'
    flop_pattern = '\*\*\* FLOP \*\*\*:'
    turn_pattern = '\*\*\* TURN \*\*\*:'
    river_pattern = '\*\*\* RIVER \*\*\*:'
    if re.search(preflop_pattern, line):
        state = 0
    elif re.search(flop_pattern, line):
        state = 1
    elif re.search(turn_pattern, line):
        state = 2
    elif re.search(river_pattern, line):
        state = 3


    # Game ID and blind information
    pattern = '^Game ID: (\d+) (\d*\.?\d+)/(\d*\.?\d+)'
    match = re.search(pattern, line)
    if match:
        gameID = int(match.group(1))

    # smallBlind? bigBlind?
    pattern = '^Player (\S+) has small blind'
    match = re.search(pattern, line)
    if match:
        playerID = match.group(1)
        data.loc[(data["gameID"] == gameID) & (data["playerID"] == playerID), "smallBlind?"] = True
    pattern = '^Player (\S+) has big blind'
    match = re.search(pattern, line)
    if match:
        playerID = match.group(1)
        data.loc[(data["gameID"] == gameID) & (data["playerID"] == playerID), "bigBlind?"] = True

    # Action
    pattern = '^Player (\S+) (bets|folds|calls|raises)\s?\(?(\d*\.?\d+)?\)?'
    match = re.search(pattern, line)
    if match:
        playerID = match.group(1)
        action = match.group(2)
        if state == 0:
            if match.group(3) is None:
                data.loc[(data["gameID"] == gameID) & (data["playerID"] == playerID), "preflopAction"] = action
            else:
                data.loc[(data["gameID"] == gameID) & (data["playerID"] == playerID), "preflopAction"] = action
                amount = float(match.group(3))
                data.loc[(data["gameID"] == gameID) & (data["playerID"] == playerID), "preflopAmount"] = amount
        if state == 1:
            if match.group(3) is None:
                data.loc[(data["gameID"] == gameID) & (data["playerID"] == playerID), "flopAction"] = action
            else:
                data.loc[(data["gameID"] == gameID) & (data["playerID"] == playerID), "flopAction"] = action
                amount = float(match.group(3))
                data.loc[(data["gameID"] == gameID) & (data["playerID"] == playerID), "flopAmount"] = amount
        if state == 2:
            if match.group(3) is None:
                data.loc[(data["gameID"] == gameID) & (data["playerID"] == playerID), "turnAction"] = action
            else:
                data.loc[(data["gameID"] == gameID) & (data["playerID"] == playerID), "turnAction"] = action
                amount = float(match.group(3))
                data.loc[(data["gameID"] == gameID) & (data["playerID"] == playerID), "turnAmount"] = amount
        if state == 3:
            if match.group(3) is None:
                data.loc[(data["gameID"] == gameID) & (data["playerID"] == playerID), "riverAction"] = action
            else:
                data.loc[(data["gameID"] == gameID) & (data["playerID"] == playerID), "riverAction"] = action
                amount = float(match.group(3))
                data.loc[(data["gameID"] == gameID) & (data["playerID"] == playerID), "riverAmount"] = amount

    # finalWinnings of the hand
    pattern = 'Player (\S+).*(Wins|Loses): (\d*\.?\d+)?'
    match = re.search(pattern, line)
    if match:
        playerID = match.group(1)
        status = match.group(2)
        amount = float(match.group(3))
        if status == "Wins":
             data.loc[(data["gameID"] == gameID) & (data["playerID"] == playerID), "finalWinnings"] = amount
        else:
            data.loc[(data["gameID"] == gameID) & (data["playerID"] == playerID), "finalWinnings"] = amount * -1.0
data.head(20)
Now that the data is made readily available for analysis in the form of a convenient DataFrame, we are almost ready to move onto Exploratory Data Analysis. However, there is still one last step...
Step 3: Wrapping up the Data
One flaw that exists is that the final winnings are on a per hand basis. In order to analyze trends we should create a running sum of winnings for each player. To do so, we will create a new DataFrame that contains playerIDs and their cumulative winnings.
uniq_players = data["playerID"].unique()
win_df = pd.DataFrame(uniq_players, columns=["playerID"])
win_df["cumulativeWinnings"] = 0.0
for index, row in win_df.iterrows():
    playerID = row["playerID"]
    lis = data.loc[data["playerID"] == playerID]["finalWinnings"]
    cumulative = sum(lis)
    win_df.at[index, "cumulativeWinnings"] = round(cumulative, 2)
win_df.head(10)
This dataset was published by the player with the playerID "IlxxxlI", who, as we can see, has a pretty high cumulative winnings statistic. With this information, now we can move onto EDA.
Exploratory Data Analysis
To begin with our data analysis, we will attempt to uncover trends by visualizing the data. The DataFrame we made in the last section is a great place to start. Plotting the cumulativeWinnings for each player can give us some insight into which players are the most profitable. The best way to represent this trend is with a bar plot. However, since there are too many data points, I will be filtering for the biggest winners and losers.
new_df = win_df[(win_df["cumulativeWinnings"] >= 150) | (win_df["cumulativeWinnings"] <= -200)]
players = new_df["playerID"]
winnings = new_df["cumulativeWinnings"]
plt.figure(figsize = (24, 10))
barlist = plt.bar(players, winnings, align='center')
plt.xticks(players, rotation='vertical')
plt.ylabel('winnings')
plt.title("Poker Winnings by Player")
plt.show()

From the graph, we can see that players aleaga and IlxxxlI were the most profitable. Meanwhile lia007, MadLifeGrinder, AironVega, and meandkids lost the most money during their poker sessions.
Data Transformation
With these results, we can hypothesize that there are some quantifiable play styles that result in certain players making more and some players losing more. There are 3 measures that could explain this disparity:
VPIP
VPIP is measured as a player's frequency of calling, betting, or raising before the flop. A higher VPIP percentage indicates that a player is looser. A lower VPIP indicates that a player is tighter. According to Poker Copilot, between 15% and 20% is a good VPIP. The formula for calculating VPIP is as follows:
(# of raises and bets preflop)/(# of hands played)
vpip_df = data.groupby(["playerID", "preflopAction"]).size().unstack().fillna(0)
player_freq = data["playerID"].value_counts().sort_index()
vpip_df["handsPlayed"] = player_freq
win_df = win_df.sort_values("playerID").set_index(vpip_df.index)
vpip_df["cumulativeWinnings"] = win_df["cumulativeWinnings"]
According to Poker Copilot, a minimum of 25 hands must be played to gain meaningful insight on play style. For this reason, in this DataFrame and all following DataFrames, players who have played less than 25 hands will be dropped from the analysis. Now, in order to see if there exists a correlation between VPIP and winning, we will plot the two against each other.
vpip_df = vpip_df[vpip_df["handsPlayed"] >= 25]
vpip_df["VPIP"] = 0.0
for index, row in vpip_df.iterrows():
    put = row["calls"] + row["raises"]
    hands = float(row["handsPlayed"])
    vpip = 100.0 * put / hands
    vpip_df.at[index, "VPIP"] = vpip
x = vpip_df["VPIP"]
y = vpip_df["cumulativeWinnings"]
plt.figure(figsize = (12, 8))
plt.scatter(x, y)
plt.title("Winnings vs. VPIP")
plt.xlabel("VPIP %")
plt.ylabel("Winnings $")
plt.show()

As we can see from the plot, players with VPIPs around 18-20% have the highest winning sums. However, the players who lost the most money also had VPIPs around this range. This signifies that VPIP may not be the most accurate quantifier to determine winning.
PFR
PFR is measured as a player's frequency of raising before the flop. A player's PFR cannot be higher than his or her VPIP. Poker Copilot defines a good PFR as being 2-3% lower than a player's VPIP.
(# of raises preflop)/(# of hands played)
data_df = vpip_df.copy()
data_df["PFR"] = 0.0
for index, row in data_df.iterrows():
    put = row["raises"]
    hands = float(row["handsPlayed"])
    pfr = 100.0 * put / hands
    data_df.at[index, "PFR"] = pfr
x = data_df["PFR"]
y = data_df["cumulativeWinnings"]
plt.figure(figsize = (12, 8))
plt.scatter(x, y)
plt.title("Winnings vs. PFR")
plt.xlabel("PFR %")
plt.ylabel("Winnings $")
plt.show()

Again, like the VPIP graph, the highest and lowest earners fall within the same range. The aforementioned range is between 10 and 16%.
Agg
Unlike VPIP and PFR, Agg measures a player's frequency of raising after the flop. A good Agg range is between 50% to 60%. The formula is as follows:
(# of raises postflop)/(# of hands played post flop)
players = data["playerID"].unique()
players.sort(axis=0)
temp_df = data.groupby(["playerID", "flopAction"]).size().unstack().fillna(0)
temp_df2 = data.groupby(["playerID", "turnAction"]).size().unstack().fillna(0)
temp_df3 = data.groupby(["playerID", "riverAction"]).size().unstack().fillna(0)
agg_df = pd.DataFrame(players, columns=["playerID"])
agg_df["flopBets"] = temp_df["bets"].values
agg_df["flopRaises"] = temp_df["raises"].values
agg_df["turnBets"] = temp_df2["bets"].values
agg_df["turnRaises"] = temp_df2["raises"].values
agg_df["riverBets"] = temp_df3["bets"].values
agg_df["riverRaises"] = temp_df3["raises"].values
agg_df["total"] = 0.0
agg_df["Agg"] = 0.0
temp_df4 = data.groupby(["playerID", "preflopAction"]).size().unstack().fillna(0)
player_freq = data["playerID"].value_counts().sort_index()
new_df = temp_df4
new_df["hands"] = player_freq.values
new_df["played"] = new_df["hands"] - new_df["folds"]
agg_df["handsPlayed"] = new_df["played"].values
for index, row in agg_df.iterrows():
    total = row["flopBets"] + row["flopRaises"] + row["turnBets"] + row["turnRaises"] + row["riverBets"] + row["riverRaises"]
    hands = row["handsPlayed"]
    if hands == 0:
        agg = 0.0
    else:
        agg = 100.0 * total/hands
    agg_df.at[index, "total"] = total
    agg_df.at[index, "Agg"] = agg
agg_df = agg_df[agg_df["handsPlayed"] >= 25]
agg_df["cumulativeWinnings"] = 0.0
agg_df.reset_index(inplace=True)
for index, row in agg_df.iterrows():
    playerID = row["playerID"]
    lis = data.loc[data["playerID"] == playerID]["finalWinnings"]
    cumulative = sum(lis)
    agg_df.at[index, "cumulativeWinnings"] = round(cumulative, 2)
x = agg_df["Agg"]
y = agg_df["cumulativeWinnings"]
plt.figure(figsize = (12, 8))
plt.scatter(x, y)
plt.title("Winnings vs. Agg")
plt.xlabel("Agg %")
plt.ylabel("Winnings $")
plt.show()

Lastly, in order to standardize winnings and hedge against anomalies, we need a way to normalize winnings. A player could be doing pretty average in a low blind game then win a huge pot in a high blind game. This would signify an anomaly that could be protected against with the following method.
Big Blinds Won / 100 Hands
If this measure is postive, that means you are winning. If this is negative, you are not winning. In order to calculate Big Blinds Won / 100 Hands you use the following formula:
Sum[(Hand Winnings)/(100 * BigBlind)]
data["winShare"] = 0.0
for index, row in data.iterrows():
    winnings = row["finalWinnings"]
    bigBlind = row["bigBlindAmount"]
    winShare = winnings / (100 * bigBlind)
    data.at[index, "winShare"] = winShare
win_df.reset_index(inplace=True, drop=True)

win_df["BBW/100"] = 0.0
for index, row in win_df.iterrows():
    playerID = row["playerID"]
    lis = data.loc[data["playerID"] == playerID]["winShare"]
    cumulative = sum(lis)
    win_df.at[index, "BBW/100"] = round(cumulative, 2)
win_df.head()
As you can see from above, the new Big Blinds Won / 100 Hands metric provides a normalized measure for success at the poker table. Now, we will re-examine the VPIR, PFR, and Agg metrics against Big Blinds Won / 100 Hands. For sake of analysis and convenience, I will only be recomputing these statistics with the players who played 25 or more post flop hands.
vpip_df.columns = [0, 1, 2, 3, 4, 5, "VPIP"]
vpip_df.drop(columns=[0, 1, 2, 3, 4, 5], axis=1, inplace=True)
vpip_df.reset_index(inplace=True)
data_df.columns = [0, 1, 2, 3, 4, 5, 6, "PFR"]
data_df.drop(columns=[0, 1, 2, 3, 4, 5, 6], axis=1, inplace=True)
data_df.reset_index(inplace=True)
agg_df.columns = [0, "playerID", 2, 3, 4, 5, 6, 7, 8, "Agg", 9, 10]
agg_df.drop(columns=[0, 2, 3, 4, 5, 6, 7, 8, 9, 10], axis=1, inplace=True)
win_df.reset_index(inplace=True, drop=True)
# new dataframe based on joined data from all three metrics
new_df = pd.merge(win_df, vpip_df)
new_df = pd.merge(new_df, data_df)
new_df = pd.merge(new_df, agg_df)
new_df.head(10)
x = new_df["VPIP"]
y = new_df["BBW/100"]
plt.figure(figsize = (12, 8))
plt.scatter(x, y)
plt.title("Big Blinds Won per 100 Hands vs. VPIP")
plt.xlabel("VPIP %")
plt.ylabel("Big Blinds Won per 100 Hands")
plt.show()


x = new_df["PFR"]
y = new_df["BBW/100"]
plt.figure(figsize = (12, 8))
plt.scatter(x, y)
plt.title("Big Blinds Won per 100 Hands vs. PFR")
plt.xlabel("PFR %")
plt.ylabel("Big Blinds Won per 100 Hands")
plt.show()

x = new_df["Agg"]
y = new_df["BBW/100"]
plt.figure(figsize = (12, 8))
plt.scatter(x, y)
plt.title("Big Blinds Won per 100 Hands vs. Agg")
plt.xlabel("Agg %")
plt.ylabel("Big Blinds Won per 100 Hands")
plt.show()


While the data seems to be pretty standard, there exists a single outlier in each metric. Poker ultimately is somewhat luck-based, so the results may be skewed pretty heavily. But by analyzing the one outlier, it seems as if a good VPIP is around 17%, a good PFR is around 10%, and a good Agg is around 38%. There are many unknown factors present as well due to the nature of the data. The general shapes of the data do not seem to be polynomial or linear.
Machine Learning and Prediction Model
Given what we know regarding these statistics, now we can try and train a model to predict the number of big blinds won per 100 hands given VPIP, PFR, and Agg. To do so, we use the Sci-Kit Learn library. Specifically, we will be attempting to establish a Linear Regression Model with VPIP, PFR, and Agg as independent variables and big blinds won per 100 hands as the dependent variable. My hope for this are not high. The data does not appear to be polynomial or linear, which makes training a predictive model very difficult.
X = new_df[["VPIP", "PFR", "Agg"]]
Y = new_df["BBW/100"]

regr = LinearRegression()
regr.fit(X, Y)

print('Intercept: \n', regr.intercept_)
print('Coefficients: \n', regr.coef_)

model = sm.OLS(Y, X).fit()
pred = model.predict(X)

model.summary()
Based on the r^2 value from the statsmodel summary, the data has very little correlation with the model. I expected this since the poker hand data was skewed to begin with as it mainly tracks the play style of a single player. Additionally, some added problems include a large variance in the type of games played in the dataset. The play styles of players in a 0.5/1 small blind/ big blind game differs in a meaningful way from a 2.50/5 small blind/ big blind game. Since the dataset contained information from both of these game types, it becomes hard to succesfully correlated play style statistics like VPIP and Agg. Knowledge about the professional levels of poker experience of all players is assumed to be high. Beginner and intermediate players are usually not concerned about VPIP, PFR, and Agg, so there exists another degree of variance. Ultimately, finding higher quality data (which is not readily accessible online) and proccuring more data points could serve to improve these experimental results.
Conclusion
After scraping the web for Texas Hold'em data points, some relevant and important statistical measures were observed. In order to consistently make money in poker, a player must represent him or herself well. Measures like VPIP, PFR, and Agg are all important poker statistics that can make you a better player, whether a beginner player, intermediate player, or professional player.
The data set used proved to be unreliable, but given the circumstance, it was the only dataset that I could find. In order to truly uncover trends and build a predictive model to find success factors, more datapoints are necessary and less subjective data must be used. This dataset was collected by a single player based on his online casino experiences, which is not a great representation of poker players, as a whole.
One thing that came from this analysis, though, was identifying a winning poker strategy for the player at hand. From the exploratory data analysis, it seems as if a good VPIP is around 17%, a good PFR is around 10%, and a good Agg is around 38%, as these frequencies worked well for the player. Analyzing your own play style, finding out your weaknesses and strengths, is crucial if you wish to make money while playing Texas Hold'em. Texas Hold'em is mainly a game of strategy and psychology, with a little bit of luck involved. By performing analysis like this on your own poker experiences, you can learn and build better strategies to win money in online casinos and in live games.